Damping Evaluation

In engineering, the damping ratio (ζ) is a dimensionless measure describing how oscillations in a system decay after a disturbance.  One way to evaluate the damping ratio is to excite the system and then use what is called the log decrement method to evaluate the damping.  Figure 1 illustrates the log decrement method.

Fig_1

Unfortunately, real systems don’t always behave in a way that allows clear use of the log decrement.  Figure 2 illustrates the motion of a tall (~80 m) exhaust stack that is excited and then allowed to vibrate freely.

Fig2

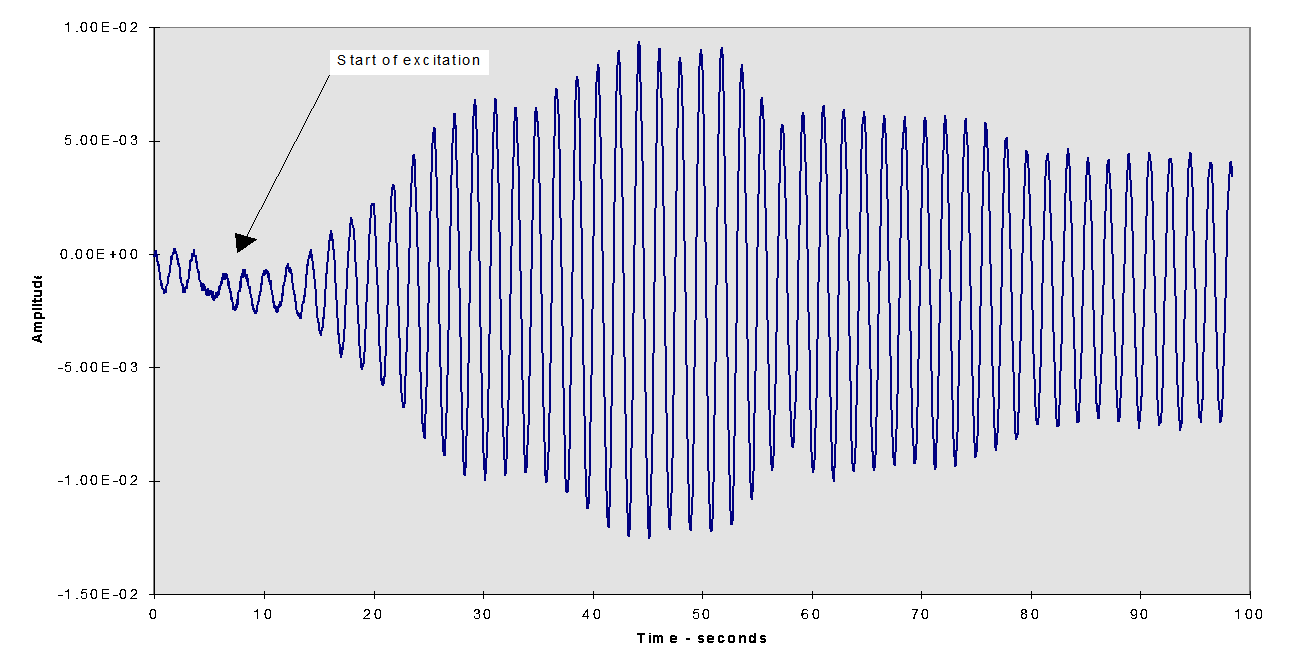
The vibration signal has been filtered to remove all but the natural frequency (~0.54 Hz) of the stack.  If the stack was viscously damped, we would expect to see an exponential decay in the motion and the log decrement method could be used to evaluate the damping ratio.  If coulomb (friction) damping controlled, we would expect to see a linear decay in the motion with time.  Looking at Figure 2, neither type of decay is evident.

In order to get a clearer measure of the damping, it is often useful to use a technique that is often used in the acoustical world.  If the vibration amplitude is plotted on a logarithmic scale, it can be shown that:

ζ = 0.183/n                  Equation 1

Where:  n = number of cycles required for the amplitude to drop by 10 dB (a factor of approximately 3.16).

The motion data in Figure 2 has been potted with a logarithmic scale in Figure 3.

fig3

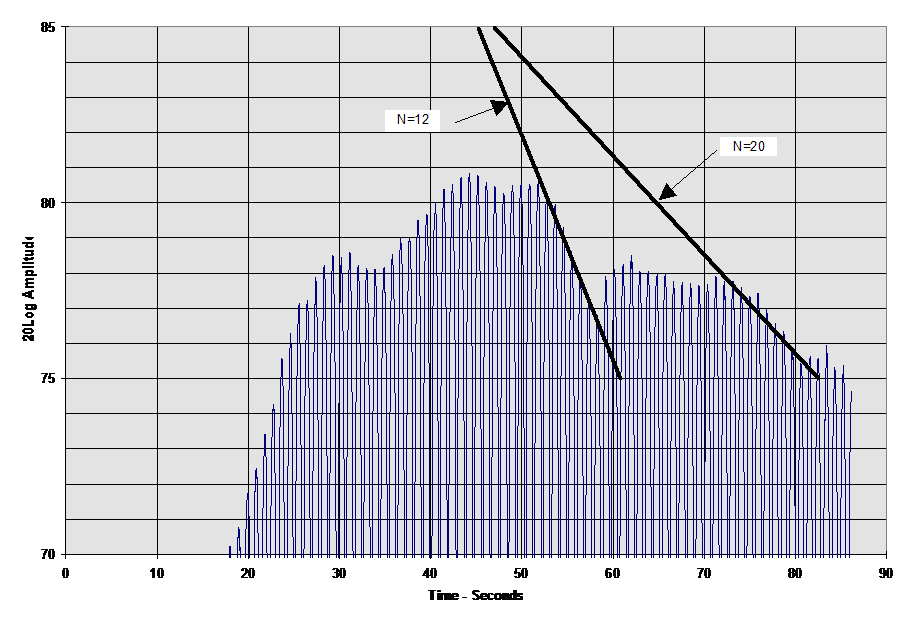
There are two distinct regions of decay in this portion of the signal.  A straight line passing through the first decay segment indicates that the signal would take approximately 12 cycles to decay by 10 dB.  A line passing through the second decay segment indicates that the signal would take approximately 20 cycles to decay 10 dB.  Using the Equation 1, the respective damping values would be 0.015 and 0.009.  The decreasing damping ratio as a function of amplitude is a strong indication that the damping in the stack is coulomb or frictional rather than viscous.

By: Mike Porter

Middle East Sulphur Plant Operations Network (MESPON) Forum

Mike Porter, Principal Engineer at PMI, will be in Abu Dhabi, UAE, the week of October 18-22 participating in the second annual Middle East Sulphur Plant Operations Network (MESPON) Forum.

MESPON 2015 is an interactive conference aimed at fostering enduring, cooperative relationships between sour gas and sulphur plant operators across the UAE and the Middle East.

With the region on track to become the world’s largest sulphur producer by 2020, and home to some of the world’s largest sour gas development projects, there is an impetus to develop and enhance local capabilities for dealing with the challenges of gas sweetening and sulphur recovery. The MESPON forum is, therefore, intended to bring together senior level sour gas and sulphur plant process, operations and maintenance personnel for ongoing technical knowledge sharing, lessons-learned capture and communication, and establishment of best practices and plant benchmarking.

The 3-day agenda will feature presentations, workshops, panel discussions and break-out work group sessions focusing on all facets of sulphur management, from wellhead to port. There will also be a session on project execution that addresses the critical communication link between project and operations personnel. MESPON contributors, such a PMI’s Mr. Porter, include some of the world’s leading experts in sour gas treating and sulphur product handling.  Also in attendance will be experienced industry professionals from plant testing and monitoring companies and select major equipment providers and technology licensors.

Using Java Script To Create Animations Within Star CCM+

Adding motion to your simulation results can produce better understanding for all interested parties. Through exploiting the Java macro functionality offered in Star-CCM+ the camera’s position can be incrementally adjusted through multiple steps, while an image is saved at each step.  Using this functionality the model and results can be rotated, panned and zoomed automatically.  The saved images can then be stitched together using a wide variety of animation programs (Windows Movie Maker, ImageMagick, etc…).

PMI has developed a Java script that links to a local coordinate system within the Star-CCM+ model.  Using this coordinate system a wide variety of scene transformations can be implemented to create animations.  PMI has provided a copy of this script with this week’s update[1].  This script include a graphical user interface (GUI) to allow for most of the model transformations to be coded without the user needing to modify the underlying Java code.

The basics for using the script are as follows:

  • Copy the script into a text file and save it. Rename the file as ‘rotate_zoom_translate_GUI’ and change the extension from ‘.txt’ to ‘.java’.
  • Open your simulation file in Star CCM+. Run the ‘rotate_zoom_translate_GUI.java’ macro from ‘Play Macro…’ option.
  • Interactive dialogue boxes will pop-up to communicate information and will allow you to input variables for view transformations.

[1] NOTE:  This script was developed for PMI’s internal use and is provided without warranty.  PMI will not offer technical support for script modifications.

Java Code — Rotate_Zoom_Translate_GUI


By Lilunnahar Deju

New Website!

WEBSITE

Welcome to the new Porter McGuffie website. The new site has many new features. You are now able to search the site for keywords! You can also view and download many technical papers we have published. You can even watch cool videos of projects.
The News section will be updated often with a variety of things. Expect new papers we publish or even a quick educational video.